Microsoft Fabric September 2023 Update


Welcome to the September 2023 update.
We have lots of features this month including updates to the monitoring hub, Fabric Metrics app, VS code integration for Data Engineering, Real-time data sharing and many more. Continue reading for more details on our new features!
Contents
- Core
- Power BI
- General
- Reporting
- Modeling
- Data Connectivity
- Service
- Mobile
- Developers
- Visualizations
- New visuals in AppSource Change Chart
- Beeswarm Chart
- Explore time-based data down to each millisecond with Drill Down TimeSeries PRO
- New Updates for accoPLANNING (Release 57)
- Zebra BI Charts on-visual settings
- Word Cloud by Powerviz
- Innofalls Charts: A Versatile and Interactive Visual
- Hierarchy Chart by MAQ Software
- Power BI JSON Report Theme Generator by BIBB
- Synapse
- Data Warehouse
- Data Engineering
- VS Code Integration
- Introducing Notebook File System support in Synapse VS Code extension for Data Engineering and Data Science workload in Microsoft Fabric
- Import Notebook in Workspace view
- Mssparkutils new API for fast data copy
- Support diff versions when saving notebook
- Notebook Sharing with Execute-only mode
- Notebook resources .whl file support
- Real-time Analytics
- OneLake shortcut to delta tables from KQL DB
- Real-Time Data Sharing: Introducing database shortcuts in Real-Time Analytics
- Sample Gallery – Explore what you can achieve in Real-Time analytics
- Model and Query data as graphs using Kusto Query Language (KQL)
- Easily connect to KQL Database from Power BI desktop
- Eventstream now supports AMQP format connection string for data ingestion
- Eventstream supports data ingestion from Azure IoT Hub
- Improved Eventstream Creation Speed
- Data Factory
- Community
Core
Monitoring hub – column options
We have released a new feature inside the monitoring hub to better users customize their experience.
Column options gives users more room to operate. Users can select and reorder the columns that meet the scene according to their customized needs. Regardless of whether the user switches to any other tool or scene in Fabric, these columns options are persisted along with the filter until the user returns again.

You can now easily reorder the columns with drag and drop inside the option menu. You do not need to worry about the ones at the bottom. All the selected column options will be bubbled up to the top of the menu when you open it next time. Try it out yourself!


OneLake
OneLake file explorer (v.1.0.10) – Menu Option to View Workspaces and Items Online
We are excited to announce the new release of OneLake file explorer for Windows! Now you can seamlessly transition between using the OneLake file explorer app and the Fabric web portal. When browsing data in OneLake file explorer, right click on a workspace and select “OneLake->View Workspace Online.” Selecting this will open the workspace browser on the Fabric web portal. Similarly for items within your workspace.
In addition, you can now easily find your client-side logs, which you may need to troubleshoot issues. Right-click on the OneLake icon in the Windows notification area, select Diagnostic Operations, then Open logs directory.
Get started by downloading the latest OneLake file explorer.
Power BI
General
Upgrade Power BI Desktop .NET Framework to 4.7.2 or newer
Power BI Desktop with .NET Framework 4.5 will no longer be supported after 9/30/2023. Please upgrade to .NET Framework 4.7.2 or newer to avoid any support issues.
Reporting
Mobile layout interactive canvas
With this latest update we are happy to announce that we have made the mobile canvas interactive.
This new capability provides the ability to test how buttons, slicers, and visuals will behavior on the app before publishing the report.

But that’s not all. With this canvas interactivity, users can now interact with visuals directly and adjust Table and Matrix column headers to align perfectly with mobile screens.

Smart Narrative improvements
The Smart Narrative visual can now display either text or numeric values when showing data for a column. Previously this was limited to only numeric values.

Learn more about the Smart Narrative’s summarization capabilities at Create smart narrative summaries – Power BI | Microsoft Learn.
Modeling
Edit your data model in the Power BI Service – Updates
The new data model editing in the Service feature was released to preview in April. We’ve been busy reacting to your feedback and enhancing the experience. Below are the improvements coming later this month:
Improve layouts limitations
Changes you make to layouts will now persist between Desktop and the Service, including:
- Changes made to data model layouts in Desktop will now be incorporated into the Service upon uploading the .PBIX file.
- Similarly, changes made to layouts in the data model within the Service will now be incorporated in the Desktop upon downloading the .PBIX file.
Please continue to submit your feedback directly in the comments of this blog post or in our feedback forum.
Edit linguistic relationships in Q&A setup
The Q&A visual is an effective way to help users further understand their data by asking questions and receiving answers in the form of visuals. It offers users a way to explore their data in ways not covered by the rest of the report without requiring deeper knowledge of their data model or report authoring.

However, while the Q&A engine is good at answering precise questions about data, it may not be able to associate every word or phrase a user inputs with data in the model. For example, answering “what are our best consoles this year?” may require connecting the term consoles to the name products in the model, and understanding that the term best corresponds to the highest sales values. These terms are contextual, however – users could mean something completely different asking for console and best in other industries, organizations, or even datasets.
To help authors ensure that the Q&A visual provides consistent and accurate answers based on the unique language their report consumers actually use, we introduced Q&A setup tools with an emphasis on providing Q&A with synonyms for column and table names in the model. This way, authors can explicitly define console as referring to products, and users will always receive the correct answers when they ask similar questions in the future.
However, synonyms (nouns) are only half of the picture. The other half of the terms (adjectives, verbs, prepositions, adverbs) can’t be defined with such straightforward mappings because they must be understood as a part of a phrase – they qualify other terms or relate other terms together. Best in the previous example is one; asking “who sold the most books” requires us to know that stores sell books, connecting stores to books.
There are many types of these linguistic relationships, so we built a new tab entirely to help you create and manage linguistic relationships for your data. You can get into the Q&A setup menu using the gear icon on the Q&A visual or the Q&A setup option in the Modeling tab of the ribbon, then selecting the new Relationships tab.

There, you’ll be able to define a variety of relationships, including verb, adjective, noun, preposition, and more. Choose a type which fits the term you’re trying to define (for example, “best” is an adjective), then follow the prompts to define what it means in the context of your data.
Our investment into Q&A does not stop here. Even in a world where natural language capabilities are increasingly driven by large language models, there is value in the precision, consistency, and customizability of our sophisticated Q&A engine. In the other direction, defining synonyms and relationships can be a lengthy process just asking to be streamlined with the power of AI-generated suggestions. Keep an eye out in the future for the ways we’re bridging the two to bring out the best of both worlds!
DAX function changes to MINX and MAXX
We have added an optional variant parameter to MINX and MAXX DAX functions. These functions ignore text and Boolean values when there are variants or mixed data types, such as text and numeric. Now with the new optional variant parameter set to TRUE, the functions will consider the text values.
Here is an example of a variant measure. In the table below the variant measure is ordered in ascending order:

MINX and MAXX without the variant parameter set, or set to FALSE, will ignore text and Boolean data types.

MINX and MAXX with the variant parameter set to TRUE will now include text values. Boolean values are still ignored.

The default of the MINX and MAXX optional variant parameter is FALSE, so all existing DAX expressions using MINX and MAXX will not be impacted by this change. To allow text values to be included, you can update the DAX expression to include TRUE as the third parameter.
Read more about these changes at Microsoft Learn:
MINX function (DAX) – DAX | Microsoft Learn
MAXX function (DAX) – DAX | Microsoft Learn
Edit relationships in the properties pane (GA)
We are excited to announce the general availability of the edit relationships in the properties pane! The edit relationships in the properties pane has been available for public preview since the October 2022 release. Now you can click on any relationship line in the modeling to edit your relationship in the properties pane. This is available in the Model view of Power BI Desktop and in web modeling of the Power BI service. Edit relationships without running queries to preview the data and only validating the relationship when you click apply changes. A welcome relief for those using DirectQuery storage mode, as these queries can take time and impact your data sources.
You can learn more about how to utilize this feature at Create and manage relationships in Power BI Desktop – Power BI | Microsoft Learn.
Data Connectivity
SAP HANA (Connector Update)
The update enhances the SAP HANA connector with the capability to consume HANA Calculation Views deployed in SAP Datasphere by taking into account SAP Datasphere’s additional security concepts. This enables consumption of Calculation Views in Datasphere and allows customers to connect to HANA Cloud views without the need for additional privileges on the _SYS_BI schema.
Emplifi Metrics (New Connector)
We are happy to announce the release of the new Emplifi Metrics connector. Please find release notes from the Emplifi team below:
“Integrating social media insights alongside the rest of your marketing or business intelligence data gives you a holistic understanding of your entire digital strategy, all in one place. With Emplifi Power BI Connector, you’ll be able to include social media data from the Emplifi Platform in your charts and graphs and combine them with other data you own.
The Power BI Connector is a layer between Emplifi Public API and Power BI itself. It helps you work with your data intuitively, directly in the Power BI tool. The majority of data and metrics available in the Emplifi Public API are also available in the Connector.
Please visit the official documentation for more information about Emplifi Public API and a list of available metrics. You’ll find it here: https://api.emplifi.io/.”
Service
Row-level security test as role improvements
We have listened to your feedback about the row-level security test as role experience in the Service and have made several improvements this month including:
- We have added a new dropdown, allowing you to choose and test any report connected to the dataset.

- You can now easily see important permissions details pertaining to a specific individual while role testing for that person.

- We have improved our warning and error messages.
To learn more about validating row-level security roles in the Service read our documentation.
Mobile
Supporting AAD Shared device mode (preview)
We, in Power BI continue our investments in empowering frontline workers with data and insights in their work. And in this month release, the Power BI mobile apps add support in Azure active directory shared device mode.
Shared Device Mode enables you to configure devices to be shared by a group of employees. This is very common for frontline workers, who do not use their personal device for work related tasks but are getting a work-related mobile device from a shared pool of devices for these tasks.
The Shared Device Mode enables single sign-on (SSO) and device-wide sign out for Microsoft Power BI and all other apps that support Shared Device Mode.
- Once a user signs in into a supported app, the user will be logged into any application compatible with Shared Device Mode as well.
- Once a user signs out of a supported app, all other applications integrated with shared device mode sign out, to to prevent unauthorized or unintended access by the next user.
Back to the frontline worker scenario: when an employee picks a device from a pool at the start of their shift, they need only a single sign-in to one supported app (for example Power BI), and they’re automatically signed in to all other apps that support shared device mode on the device, so the device and the apps are ready for work with the user’s account. At the end of their shift, when they sign out of one app, they’re signed out globally from all other apps that support shared device mode, having the device is ready for the next employee and can be safely handed off.
Developers
Git integration
Paginated reports now supported with git integration
Since Git integration has been launched few months ago, we supported only 2 items in Power BI- Power BI reports and Power BI datasets.
We are now excited to add a new item- Paginated reports!
After connecting your workspace to Azure DevOps, you can commit your paginated reports and have them versioned in your repository. After that, you can open the .rdl files directly from git in Power BI Report Builder, edit and push the changes into git. The workspace will identify the changes and will prompt developers to update the workspace with the changes to the paginated report.
With this feature, we are adding paginated reports developers to enjoy the collaboration, versioning and modern developer workflows offered in Power BI and Fabric. Learn more about using git with paginated reports.
Checkout and Switch Branches in a Workspace
A workspace can connect to a single branch at a time. Once you’ve setup your separate workspace to work with git, there might be scenarios where you want to change just the connection of a branch. We have now added 2 new features to help you achieve this much faster:
- Checkout branch– checkout allows you to easily create a new branch, based on the current state of the workspace.

After choosing to checkout, you can create a new branch that will be connected to the WS, while the uncommitted changes are retained. This is useful in cases of conflicts, that allows you to commit your changes to a backup branch, and then manage the merge conflict in the git repo.
- Switch branch– Workspace admins can decide to change just the connection of the branch very easily.


It’s helpful in cases you want to start working on a new branch and wipe clean your WS content for that, or when you are moving from your regular project to small bug fixes (assuming they are on the same content), that should happen on a different branch.
New E2E CI/CD tutorial now available
Many users have been asking, since the release of git integration, how to work with deployment pipelines and git as part of a CI/CD process. These two features can help build a compelling e2e flow, when connected properly. Follow this step-by-step guide to learn how to make the most out of both tools together.
Visualizations
New visuals in AppSource
Change Chart
Pro Circle Card by Devlup Funnels
Apex Milestone Trend
Dot Chart
Activity Gauge by Powerviz
Bridger Visual by BI Samurai
Bar Chart with Export Data Feature
Box Ploty by Devlup Funnels
LeapLytics – Markdown Viewer
Aimplan Data Input Table
Beeswarm Chart
Overview of Beeswarm Chart
Beeswarm chart shows the distribution of data along one axis or both axes while also showing individual points. It is like a one-dimensional or two-dimensional scatter plot but with closely-packed, non-overlapping points.
How to use this Visual
The visual is intuitive and easy to follow. Only 1 field is mandatory i.e. Bee Category.
Tip: If you don’t have any category, you can simply add a calculated column with any name and use it in the category field
Bee Size field is optional and is represented in the visual by bubble area or size. If this field is missing then all bubbles will be of same size
Bee Label field is also optional. It is used to add labels to each individual bubbles.
This chart can be used in 3 ways
Y – Axis only
X – Axis only
Scatter Plot (Both Y and X Axes)
1) Y-Axis Only
As shown in picture below, if you only use a column/field in “Beeswarm Y-Axis” section while keeping “Beeswarm X-Axis” section empty, your data will be plotted on Y-Axis categorized according to the “Bee Category” section

2) X-Axis Only
Similarly, if you only use a column/field in “Beeswarm X-Axis” section while keeping “Beeswarm Y-Axis” section empty, your data will be plotted on X-Axis categorized according to the “Bee Category” section

3) Scatter Plot (Both X and Y Axes)
If you use columns/fields in both sections i.e “Beeswarm X-Axis” section and “Beeswarm Y-Axis” section, the visual will work like a scatter plot with data points plotted on X-Axis and Y-axis . This is depicted below

You can show images inside bubbles as well using the “Images” field. For example, the report below shows top millionaires of the world with their net worth on Y-Axis and their Age on X-Axis. Its available in demo file.

Formatting Options
These options are available in the format pane of the visual under “Settings”.
1) Bubble size
As the name implies, this setting simple increases / decrease the bubble size
2) Lower Upper and Left Space
Beeswarm chart produces non colliding bubbles or in other words circles don’t overlap.
This can often cause bubbles do go outside the chart area especially when there is a concentration of data around minimum and maximum data values. This is where these settings are very useful to bring data inside the chart area. These settings increase or decrease the Y-Axis and X-Axis range to achieve this objective. Try adjusting these settings on the demo file’s sheet “ScatterPlot Beeswarm” to see how they work.

Purchase of Premium Features
To use the visual without Watermark in Power BI Online, please purchase the Visual’s license for a 1 year period. The license is for unlimited number of users and viewers.
If you have any questions, please send me email at zubair@excelnaccess.com
Download
Download the demo file here.
Download the custom visual from APPSOURCE
Explore time-based data down to each millisecond with Drill Down TimeSeries PRO
Drill Down TimeSeries PRO lets you create timeseries charts that are easy to explore on any device. Using its intuitive interactions, users can drill down to months, days or hours by clicking on the chart. Combine up to 12 series and choose between multiple charts – line, column, area. Learn more about Drill Down TimeSeries PRO!

MAIN FEATURES:
- On-chart interactions – pan, zoom and drill down
Full customization – set intervals, min/max values, colors, fonts, stacking and clustering
- Static and dynamic thresholds – set up to 4 thresholds to demonstrate KPIs
- Cross-chart filtering – select data points on multiple charts instead of using slicers
- Touch device friendly – explore your data anywhere
POPULAR USE CASES:
- Finance – stock exchange indices, capital ratios, transaction volumes
- Sales – web traffic, audience reach, lead volume
- IT – network traffic, response times, syslog and error trends
- Logistics – inventory movement and turnover, loading time, fleet maintenance costs
Get Drill Down TimeSeries PRO now!
This visual comes with 30 days free access to paid features.
ZoomCharts Drill Down Visuals are known for interactive drilldowns, smooth animations and rich customization options. They are mobile friendly and support: interactions, selections, custom and native tooltips, filtering, bookmarks, and context menu.
New Updates for accoPLANNING (Release 57)
accoPLANNING for Power BI empowers business users with writeback capabilities, advanced planning, forecasting, budgeting, project management and analysis solutions.
We have some new and exciting features for you in this release:
• Custom calculated rows and columns configuration. It allows you to customize your own client-side calculations in your already established accoPLANNING table.
• End user Lock cells. This gives the flexibility for the end user to lock cells and make sure these will not be affected by splashing or use as an approval indicator.
• Hide rows and columns. This Allows users to hide rows and columns – adding flexibility in making asymmetric column and row selections in the grid for better reporting or just for ad-hoc purpose to get a better overview.

The latest update also includes a range of new features and improvements designed to increase your productivity:
• Our navigation has undergone a major overhaul, with the most notable change being the revamped toolbar.
• Better API error message handling in the grid.
• Support for automatically expanding all rows/columns/both, eliminating the need to manually adjust the size of each cell.
With the accoPLANNING visual, you combine the planning and reporting process in Power BI. For more information, visit our website.
https://appsource.microsoft.com/en-us/product/power-bi-visuals/WA200002600?tab=Overview
Zebra BI Charts on-visual settings
Zebra BI visuals for Power BI are taking another step further to make the user experience as seamless and interactive as possible. Zebra BI Charts has received some important updates so that you save time while customizing your visuals. Thanks to the on-visual settings, you don’t need to go to the visualizations pane every time you want to make a change.

COMMENTS SETTINGS can now be adjusted directly on the visual by simply clicking on the settings icon next to the comment box. You can adjust the title, which variances you display, the icon, gap between the comments, and padding.
CATEGORY SETTINGS let you adjust several settings by just clicking on the category area. Customize the axis font (family and color), trim /rotate long labels, adjust the label density, and set the gap between the columns.
LEGEND SETTINGS come in handy when you want to rename the entries and don’t want to search for this option in the formatting pane. Adjust margins, use aliases in tooltips and switch comparisons.
STACKED CHARTS SETTINGS on the visual let you adjust the Top N feature, set color of the chart, and display labels as %.

Word Cloud by Powerviz
We are excited to announce the new Word Cloud by Powerviz, it’s an advanced visual which empowers you to create some of the most high-quality and creative word art in the Power BI.

Key Features:
- Word Styling: Make your word clouds pop with personalized text styles. It offers font styling, direction & text editing features.
- Color Options: Choose from 30+ color palettes, including color-blind safe options.
- Shapes: Want to make a statement? Create captivating word clouds by choosing shapes from icons and images, or upload your own image.
- Exclude: No more hassles anymore! Easily remove unwanted words, symbols from the text to create a clean and focused word cloud.
- Ranking: Filter out Top/Bottom N Words.
- Conditional Formatting: Easily spot words with dynamic rules.
Many other features included lasso/reverse lasso, grid view, show condition, and accessibility support.

Business Use Cases:
-
- Marketing: Sentiment analysis & SEO keywords.
- Education: Brainstorming, Improve engagement.
- Market Research: Opinion poll, open-ended survey.
- Presentation: Capture attention & easy communication.
Try Word Cloud Visual for FREE from AppSource
Check out the visual features in demo file
Step by Step instructions and documentation
To learn more, visit Powerviz website.
Introducing Word Cloud by Powerviz – A Powerful Power BI Custom Visual on YouTube
Innofalls Charts: A Versatile and Interactive Visual
Innofalls Charts is a powerful visual that offers a wide range of interactive features. Our bar and waterfalls charts come with a drill-down history, enabling orientation and facilitating comparisons. All charts can be stacked or grouped into columns.

Waterfalls: Our special attention to waterfalls includes running totals and delta waterfalls, enabling effective comparisons of measures or members. The waterfalls are expandable, drillable, stackable, and offer intermediate sums.
Drill Down History: Keep track of your drill downs with visual feedback. Change your drill downs retroactively and combine multiple drill downs for in-depth exploration.
New Comparison Features: Effortlessly make comparisons while viewing your report and incorporate deviation charts with a single click.
Interactivity: Enjoy various interactive features such as drill, expand, undo/redo, dynamic comparisons, and zoom for enhanced data exploration.
IBCS Formatting: Our IBCS theme provides scenario formatting, equal scaling, highlights, deviations and more for consistent and standardized reports.
Animations: Enhance data comprehension and reduce change blindness with animations. Promptly detect resorted or added data elements.
Discover the full potential of Innofalls Charts and get started today. Innofalls Charts is free for Power BI Desktop!
Get started today [ https://www.innofalls.com/blog-get-now ]
Visit our website [ https://www.innofalls.com/ ]
Hierarchy Chart by MAQ Software
Struggling to visualize complex hierarchical relationships? Improve understanding and decision-making with the Hierarchy Chart by MAQ software.
In today’s data-driven environment, visualizing hierarchical relationships is key to business insights and decision-making. From sales structures to budget allocations, our Power BI-verified visual offers a customizable way to represent these structures easily, catering to various business needs.

Figure 1: Sample visual showing a color-coded organization chart (with a tooltip).
Key business uses:
- Organization/HR: Organize human resources by department and hierarchy.
- Operations: Illustrate manufacturing processes, breaking down components or ingredients hierarchically.
- Finance: Show budget allocations by division or project, with color-coded subcategories to highlight differences.
- Sales: Visualize sales structure, territory responsibilities, and targets with group field indicators showing performance status.
- IT: Visualize IT assets by category and availability with detail.
Key features:
- Color-code cards using a legend.
- Adjust card (i.e. box) size, borders, and corners.
- Customize the appearance of the links connecting each card.
- Interact with cards to control levels and cross-filter visuals.
- Zoom and reposition the visual with ease.
Try out the features of the Hierarchy Chart by MAQ Software today on the visual’s sample report.
Learn more about our Power BI custom visuals on our website.
Power BI JSON Report Theme Generator by BIBB
https://powerbithemegenerator.bibb.pro/
BIBB recently released its take on the Power BI Theme Generator, aiming to streamline the theming process for users. This new tool offers a user-friendly interface, allowing for an easy selection of colours and generation of JSON themes. Within BIBB’s generator, users can choose colours in various ways, from manual selection to trending combinations and even importing from images or external sources like Coolors.

Synapse
Data Warehouse
Data Warehouse Utilization Reporting in Fabric Metrics app
We are excited to announce that Compute utilization reporting for Data warehouse and SQL Endpoint are now available in Public Preview for Microsoft Fabric across all regions! In the capacity-based SaaS world of Microsoft Fabric, customers can purchase a Fabric SKU and get entitled to a set of Capacity Units (CU). Various workloads, including data warehouse, consume capacity units based on usage.
Fabric metrics app provides visibility into capacity usage for all Fabric workloads, including data warehouse in one place. It is used by Capacity or SQL warehouse admins to identify CU usage trends across warehouse items within a capacity, monitor overload information, and understand the cost of running operations which leads to informed capacity sizing decisions.
For more information, see the detailed blog Data Warehouse Utilization Reporting in Fabric Capacity Metrics App
Column-Level security is now available on Data Warehouse and SQL Endpoint
We are excited to announce that Column-Level security is now available on Data Warehouse and SQL Endpoint.
Column-level security simplifies the design and coding of security in your application, allowing you to restrict column access to protect sensitive data. For example, ensuring that specific users can access only certain columns of a table pertinent to their department. The access restriction logic is located in the database tier rather than away from the data in another application tier. The database applies the access restrictions every time data access is attempted from any tier. This restriction makes your security more reliable and robust by reducing the surface area of your overall security system. In addition, column-level security also eliminates the need for introducing views to filter out columns for imposing access restrictions on the users.
You can implement column-level security with the GRANT T-SQL statement. Only Azure Active Directory authentication is supported.
Data Warehouse Row Level Security
We are thrilled to announce that Row-Level security is now available in Fabric Warehouse and SQL Endpoint. Row-Level Security enables you to use group membership or execution context to control access to rows in a database table.
Row-Level Security (RLS) simplifies the design and coding of security in your application. RLS helps you implement restrictions on data row access. For example, you can ensure that workers access only those data rows that are pertinent to their department. Another example is to restrict customers’ data access to only the data relevant to their company.
The access restriction logic is located in the database tier rather than away from the data in another application tier. The database system applies the access restrictions every time that data access is attempted from any tier. This makes your security system more reliable and robust by reducing the surface area of your security system.
Implement RLS by using the CREATE SECURITY POLICY Transact-SQL statement, and predicates created as inline table-valued functions.
SQL Projects support for Fabric Data Warehouse
We are excited to announce the Microsoft Fabric Data Warehouse as a supported target platform in the SQL Database Projects extension available inside of Azure Data Studio! SQL Database Projects for Azure Data Studio provides a way to design, edit, and publish schemas for SQL databases from a source controlled project. For a complete development workflow, build and deploy your database projects in CI/CD pipelines, such as GitHub Actions or Azure DevOps.
A SQL project is a local representation of SQL objects that comprise the schema for a single database, such as tables, stored procedures, or functions. Use the SQL Database Projects to extract and publish warehouse schemas directly from and to Fabric Data Warehouse. Other compatible databases include SQL Server, Azure SQL Database, Azure SQL Managed Instance, and Azure Synapse SQL (serverless and dedicated). Get started today with the insiders build of ADS.
Deployment Pipelines
In today’s world, analytics is a vital part of decision making in almost every organization. Fabric’s deployment pipelines tool provides BI creators with a production environment where they can collaborate to manage the lifecycle of organizational content. Deployment pipelines enable creators to develop and test content in the service before it reaches the users. Supported content types include reports, paginated reports, dashboards, datasets, dataflows, and now warehouses!
The deployment process lets you clone content from one stage in the deployment pipeline to another, typically from development to test, and from test to production. The connections between the copied items are kept during the copy process as well. In addition, Fabric applies the configured deployment rules to the updated content in the target stage. You can also deploy content programmatically, using the deployment pipelines REST APIs. You can learn more about this process in Automate your deployment pipeline using APIs and DevOps.
Default Dataset Improvements
We have released some new capabilities to enhance the default dataset experience:
- Turn off automatically adding new objects to the default dataset – navigate to the Warehouse artifact settings to toggle this on/off
- Updates to the manage default dataset dialog in the model view
- Filter by schema
- Filter by object (table/view)
We’ve heard your feedback about the ability to turn off the default dataset. Thank you for the feedback, we’re planning on delivering this feature in the coming months!
Data Engineering
VS Code Integration
Introducing Notebook File System support in Synapse VS Code extension for Data Engineering and Data Science workload in Microsoft Fabric
The Synapse VS Code extension empowers users to develop their notebook artifacts directly within the VS Code environment. Once users download the .IPYNB file to their local desktop, they gain the flexibility to edit, debug, and execute their notebook code locally. Furthermore, they have the option to select the kernel provided by the extension to execute and debug their notebook code on the remote Fabric Spark compute.
Python developers commonly structure reusable functions as modules in the form of .py files, a well-established software engineering best practice. Now, with the incorporation of the Notebook File System within the VS Code Synapse extension, developers can apply this principle to their Fabric notebook development. In addition to running and debugging notebook code, developers can also execute and debug code from imported modules. This integration enhances code modularity and facilitates efficient development workflows.
When a user clicks “Open Notebook Folder,” the VS Code Synapse extension not only opens the selected .IPYNB file but also downloads all associated files, including .PY modules, from the notebook file system to the local VS Code environment. This feature ensures that the entire set of necessary files and modules is readily available for seamless development and collaboration within the VS Code interface.

In this example, there is a .PY module named US2Europe.py which contains a function to covert the datetime format from US fashion to Europe’s one.

To invoke this function from the notebook side and execute it on the worker node, you need to import the module containing the function and apply into the data frame

To synchronize changes between the local environment and the remote workspace in the VS Code Synapse extension, users can take advantage of two key actions:
- Publish Resource Folder:
- Clicking the “Publish Resource Folder” button enables users to upload their local changes to the remote workspace. This ensures that any modifications made locally are reflected in the remote environment.
- Update Resource Folder:
- The “Update Resource Folder” button allows users to pull changes from the remote workspace into their local VS Code environment. This ensures that any updates made by collaborators or on the remote side are mirrored locally.
In the event that a file has been deleted in the remote workspace but still exists in the local environment, the Synapse extension will automatically handle this situation as follows:
- The deleted file will be moved to a backup folder named “__backup” under the root directory of the building folder. This approach preserves a copy of the deleted file for reference, ensuring that no data is lost during the synchronization process.
These actions provide users with an efficient and robust means to manage the synchronization of their files and code between local and remote environments while maintaining data integrity.


Import Notebook in Workspace view
We are excited to announce that we now have the “Import Notebook” entry on the Workspace -> New -> Import item! You can easily import one or more files (support .ipynb, .py, .sql, .scala, .r file format) as Fabric Notebook items in the target workspace.

Mssparkutils new API for fast data copy
We now support a new method in mssparkutils that can enable large volume of data move/copy much faster, which is:
- Mssparkutils.fs.fastcp()
You can use mssparkutils.fs.help(“fastcp”) to check the detailed usage.
According to our benchmark testing, we achieved ~7x to ~180x speed up (varies as different source type, data size and regions) compares to the traditional file system copy method mssparkutils.fs.cp().
As the below example shows, it takes ~5s to copy a 10G file from ADLS Gen2 account to Fabric Lakehouse.

Support diff versions when saving notebook
We now support viewing and comparing the differences between 2 versions of the same notebook when there are saving conflicts. This is particularly useful when more than one users are working on a same notebook instance via different clients, like:
- Publish notebook from Fabric VSCode extension
- Some users are using Manual save mode while others are collaborating
- Collaborating on notebook with unstable network
With the diff function the users in collaboration session can get notified and compare the changes from other user’s edits, and they can choose a version to keep, or save a copy of any version, to easily handle the save conflicts without losing the code accidently.

Notebook Sharing with Execute-only mode
Fabric Notebook now supports checking the “Run” operation separately when sharing a notebook, if you just selected the “Run” operation, the recipient would see a “Execution-only” notebook after opening the item. With the “Execution-only” mode you can easily spread your notebook without worrying about someone messing up the contents, while the recipients can still run the cells.

Notebook resources .whl file support
We now support uploading the .whl files in the Notebook Resources explorer, you can put your own compiled libs here, use Drag & Drop code snippet to install them in the session and import the libraries in code conveniently.

Real-time Analytics
OneLake shortcut to delta tables from KQL DB
Now you can create a shortcut from KQL DB to delta tables in OneLake, allowing in-place data queries. With this enhancement, you can effortlessly query delta tables in your Lakehouse or Warehouse directly from KQL DB. Learn more.
Real-Time Data Sharing: Introducing database shortcuts in Real-Time Analytics
A database shortcut in Real-Time Analytics is an embedded reference within a KQL database to a source database in Azure Data Explorer allowing in-place data sharing. The behaviour exhibited by the database shortcut is similar to that of a follower database.

If you are a data provider hosting data in Azure Data Explorer and want to share this data with consumers in Microsoft Fabric, you can create a database shortcut. Database shortcut enables sharing in real-time, with no need to build or maintain a data pipeline. All database changes, including schema and data, on the provider side are instantly available on the consumer side.
You can then consume data in Microsoft Fabric by using a KQL Queryset, PBI, Notebooks etc. easily .
While today, you can share data from an Azure Data Explorer database with a KQL Database, soon you will also be able to share data from a KQL Database with other KQL Database(s) in Microsoft Fabric.
Check out the announcement blog to learn more: Real-Time Data Sharing in Microsoft Fabric blog
Sample Gallery – Explore what you can achieve in Real-Time analytics
Real-Time analytics now offers a comprehensive sample gallery with multiple datasets allowing you to explore, learn and get started quickly.
Selecting a sample in Real-Time Analytics automatically creates a KQL Database with data and prewritten KQL Queryset from any of the 6 sample datasets. This will let users to get started with KQL Database and KQL Queryset without the hassle of creating database, finding the right real time dataset, ingesting data, and writing queries.
Each sample lets you explore different streaming and real time scenarios. The samples include data and queries for Stock analytics, Weather analytics, IOT analytics, Log analytics, Metrics analytics and Automotive operations analytics.
Each dataset is accompanied by a KQL Queryset which includes sample queries introducing you to KQL capabilities such as. aggregations, search , transformations using update policies, user defined functions, geospatial and time-series analytics.

Model and Query data as graphs using Kusto Query Language (KQL)
We are excited to share with you a new public preview feature of Kusto Query Language (KQL) that allows you to model and query data as graphs. Graphs are useful for representing complex and dynamic data that involve many-to-many, hierarchical, or networked relationships, such as social networks, recommendation systems, connected assets, or knowledge graphs. By using KQL with graph semantics, you get the speed and scale of KQL queries with the flexibility and expressiveness of graphs.
You can query graphs using KQL graph semantics, which has a simple and intuitive syntax that works well with the existing KQL features. You can also mix graph queries with other KQL features, such as time-based, location-based, and machine-learning queries, to do more advanced and powerful data analysis. For example, you can use time-aware graphs to examine how the graph evolves over time, or use geospatial queries to analyze the spatial distribution or proximity of nodes and edges.
To learn more about graph semantics in KQL, check out the following resources:
– Introduction to graph semantics in KQL: https://aka.ms/kusto/graph-overview
– Graph operators and functions reference: https://aka.ms/kusto/graph-operators
We hope you enjoy this new feature and find it useful for your data analysis needs. As always, we welcome your feedback and suggestions on how to improve KQL and its graph semantics extension.
Happy querying!
Easily connect to KQL Database from Power BI desktop
Power BI desktop just released new ways to easily connect to a KQL database.
There are two ways to easily locate your KQL Database:
- Open the Get Data dialog and select the Microsoft Fabric menu item. Select KQL Databases from the list:

- Open the OneLake data hub dialog from the main ribbon. Select KQL Databases from the list:

Eventstream now supports AMQP format connection string for data ingestion
AMQP, stands for Advanced Message Queuing Protocol, is a protocol that supports a wide range of messaging patterns. It’s a widely used communication protocol that facilitates efficient and reliable communication among IoT devices and systems. Now in Eventstream, you can create a Custom App source or destination and select AMQP format connection string for ingesting data into Fabric or consuming data from Fabric.

Eventstream supports data ingestion from Azure IoT Hub
Azure IoT Hub is a cloud-hosted solution that provides secure communication channels for sending and receiving data from IoT devices. With Eventstream, you can easily stream your Azure IoT Hub data into Fabric and perform real-time processing before storing it in Kusto Database or Lakehouse.


To add an Azure IoT Hub source, follow these three simple steps:
- Choose “Azure IoT Hub” as your eventstream source.
- Give this source a name and enter your Azure IoT Hub details. You may need to enter the share access key from your Azure IoT Hub to establish the cloud connection.
- On the canvas, select the IoT source and click “Data Preview” to get a preview of the incoming data from your Azure IoT Hub.
Improved Eventstream Creation Speed
In response to user feedback, we’ve made significant improvements to the Eventstream creation, enabling you to create an Eventstream item in seconds. Setting up your Eventstream is now faster and smoother than ever before. These improvements save you valuable time and allow you to ingest and transform your data streams more efficiently.
Data Factory
Data Pipeline
- The Outlook email & Teams activities in Data Factory Pipelines can now be used in collaborative shared pipeline
- New pipeline activities are now available as well! If you’ve used the Custom activity type in ADF pipelines in the past, you’ll be very familiar with the new Azure Batch activity in Fabric data pipelines. This will allow you to execute custom executables from Azure Batch for powerful pipeline workflows. We’ve also enabled Azure Functions and KQL scripts as activities in Fabric pipelines.

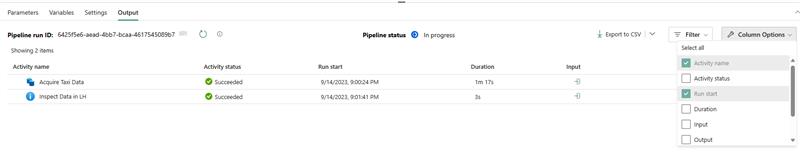
- We’ve updated the Pipeline output monitoring view to focus on simplification, easily representing pipeline run status with customizable output layouts
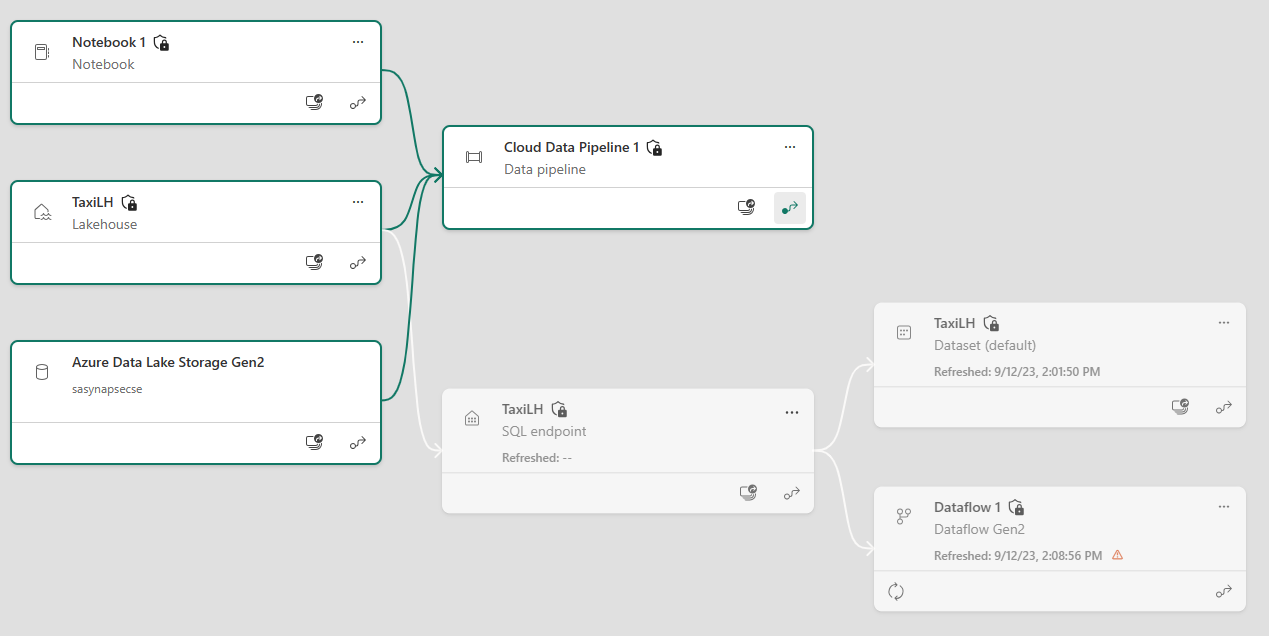
- Pipeline lineage now includes lineage for Connections


Dataflow Gen2
New Service Principal authentication kind
Service Principal has been added as an authentication type for a set of data sources that can be used in Dataset, Dataflow, Dataflow Gen2 and Datamart.
Azure service principal is a security identity that is application based and can be assigned permissions to access your data sources. Service principals are used to safely connect to data, without a user identity.

Supported data sources include:
- Azure Synapse analytics
- Azure SQL database
- Azure data Lake gen 2
- Azure data lake
- Azure blob storage
- Web
- Dataverse
- SharePoint online
Note: service principal is not supported on the on-premises data gateway and virtual network data gateway. Support is planned by the end of 2023.
Read more about Service Principal support from the official announcement post.
Bug fixes and reliability improvements
We continue to listen to your feedback and we’re actively working and making strategic fixes and quality improvements to our service.
The following is a short list of the most impactful fixes and improvements delivered in the past couple of weeks.
- Revert changes for the limit of 50 queries per dataflow. In our previous monthly update we implemented a limit to the number of queries that a dataflow could have. We reverted this limit until further notice due to a number of undesired experiences created, but we will reintroduce this limit again in the near future. If you have dataflows with more than 50 queries currently, we encourage you to start splitting them into multiple dataflows with lower number of queries, as this will give you a head-start when the limit is reintroduced in the future. This documentation article describes several best practices when developing complex dataflows that you may find useful: Best practices for designing and developing complex dataflows – Power Query | Microsoft Learn
- Multiple fixes and improvements to common error messages and scenarios. Thanks to multiple customers who have reached out to us through our support system and our Community Forum, we’ve been able to address several common issues and improve the error messages that were quite frequent.
Some of the error that have been fixed and/or modified to provide more descriptive information are:- “The current row is too large to write.”
- “We cannot convert the value null to type Table.”
- “Dataflow refresh transaction failed with status Failed”
- Errors with Dataflow connector when creating linked entities. This issue has been fixed.
We want to emphasize our commitment to our customers on improving the product and take your feedback into account in our decision making. We encourage you to engage directly with us through our support channel or through the Community forums.
Community
New learning path: Implement a Lakehouse with Microsoft Fabric
To learn more and get started, check out the Implement a Lakehouse with Microsoft Fabric learning path.
That is all for this month! Please continue sending us your feedback and as always, keep voting on Ideas to help us determine what to build next.
We are looking forward to hearing from you!

